Dev Update: Improving Procedural Texturing
Think. Implement. Release.
Hello everyone!
Today I want to talk about a big improvement for “Rocket Science” in upcoming v0.16.0 update and show some progress I’ve made.
Since the release of the game I’ve tried to find a way to improve Earth’s surface texturing. It was based on procedural technique: I can set up and configure up to 32 material layers for the particular planet. For any given point of the rendered planet, the game selects four materials from the provided list, mixes and blends them together and then displays the resulting color on screen. Which four materials will be selected is basically determined by four curves: temperature, humidity, slope and height.
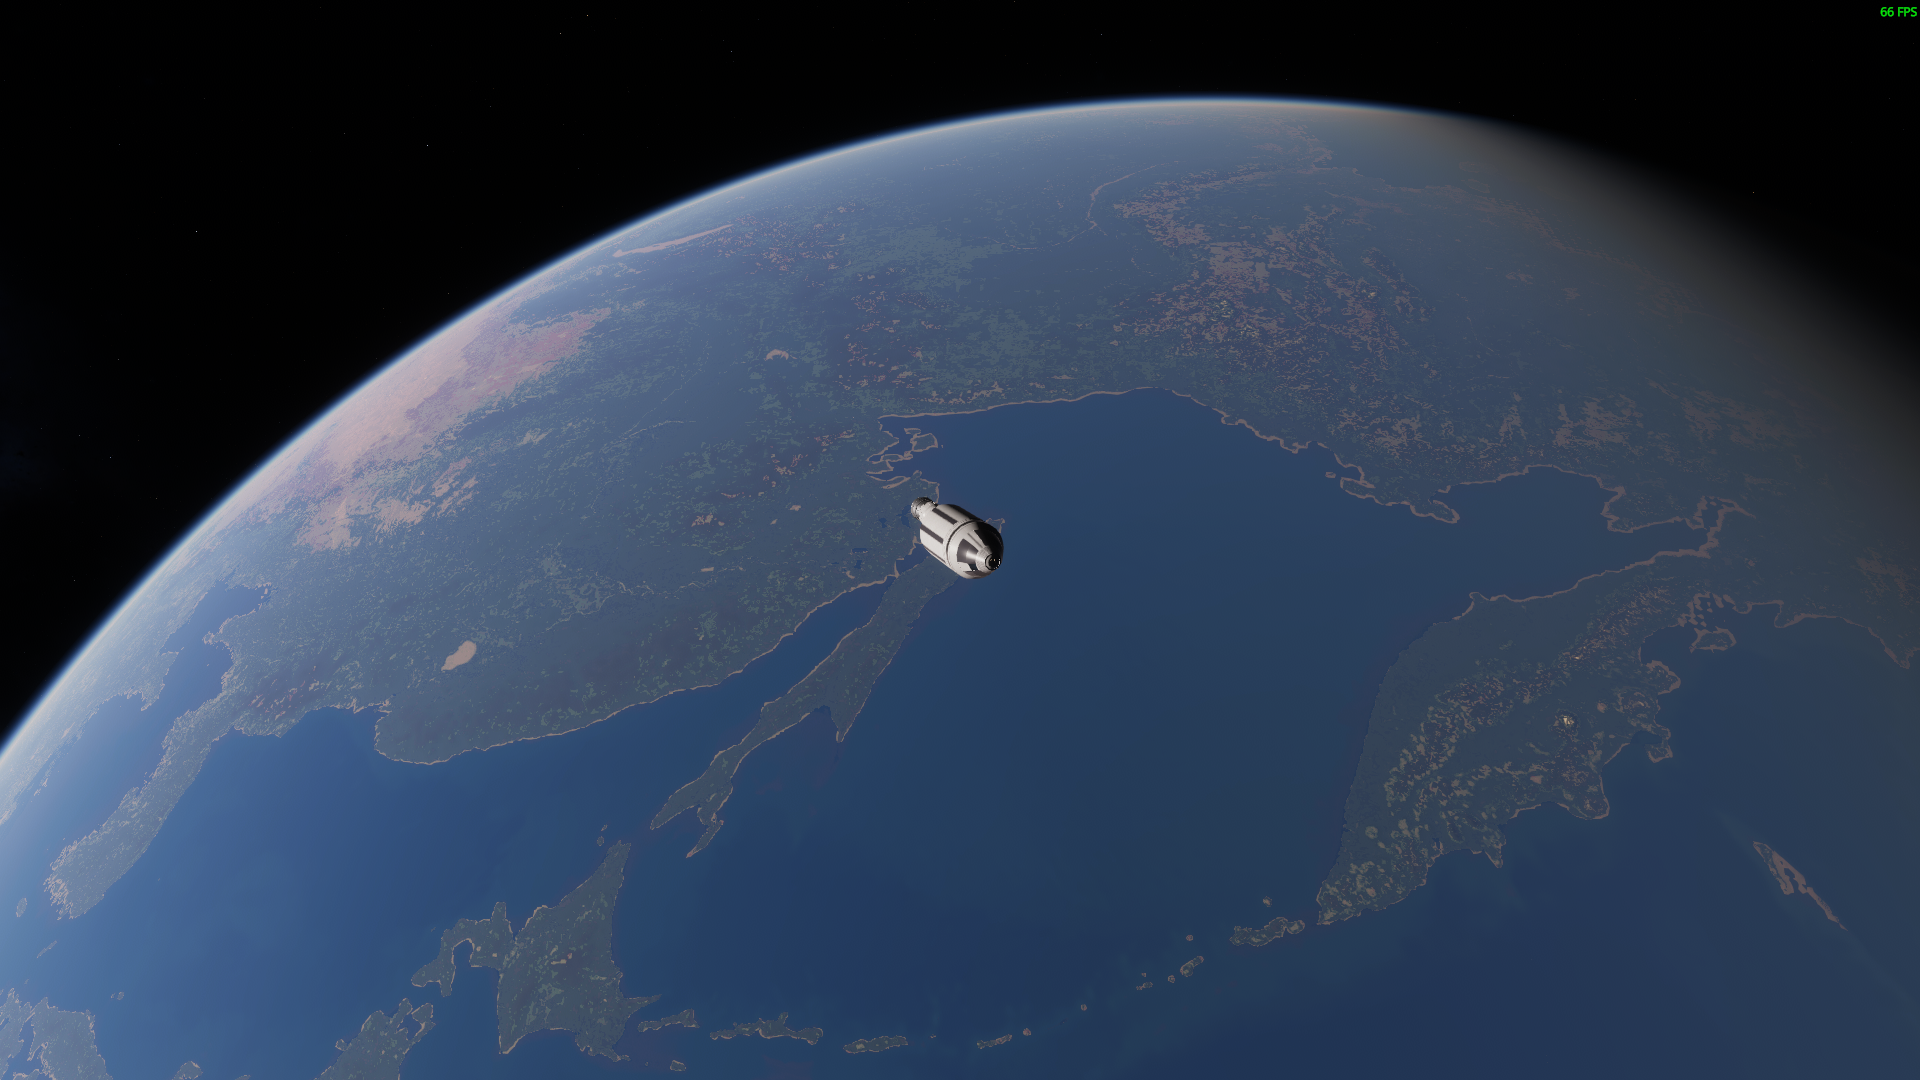
 This is how it looks like in the game engine
Each curve represents a frequency of occurrence of this material at a given parameter value. Parameters for the surface are set by planet geometry (it is very easy to calculate slope and height for it) and two grayscale maps: temperature and humidity.
All you need to do is just find or generate temperature and humidity maps, then select 32 materials, then setup 4 frequency curves for each of them and finally you get a good procedural texturing! Sounds easy, right? Well, initially I thought that too, but now I will tell you why I was wrong.
Firstly, how do you even select materials? I am not an artist nor a scientist. I have a very vague idea what colors would be right for Earth (even looking at the accurate surface color map I have). I’ve tried doing it based on eyeballing and gut feelings and the result was pretty poor.
Secondly, I’ve spent several weeks in 2020 searching for good and complete temperature and humidity maps for Earth, processing raw scientific data, which was spreaded between a hundred NASA websites (why the hell it can’t be in one place?). All I got were 8192x4096 temperature map and 4096x2048 precipitation map, which has extremely low resolution for the real planet scale. I am pretty sure, that higher resolution data exists, but I am too dumb to find it.
 An example of color map for part of the world. Generated in 2020
The last and the worst thing is how to construct frequency curves for each material. You can, again, eyeball the result, but even a slight change of one curve in one material affects the frequency of appearance of all others! In the case of a small number of materials this is manageable. For example, the Moon has only 8 different materials and it looks okay, because it has a pretty narrow color palette. But 32 colors for Earth is a bare minimum.
Basically it was impossible to do it manually and get good results. That’s why adding a new planet was a great challenge. So, I needed to find a way to somehow automate this process. I thought about this problem in the shower, on a walk, before going to bed every day for several months. Until an idea finally came to me in April. It arose from how the Moon materials were praised by players. That’s funny, because I didn’t find a temperature map for the Moon. Also it has no water, so the humidity map can’t even exist. So I used a color map converted to grayscale and just random noise instead. And results were better that for Earth. The conclusion to this story was that you don’t need scientific data to make something look good.
So the idea was pretty simple and very hard at the same time:
- get a surface color map (that exists for most planets in a huge resolutions);
- generate a color palette by selecting 32 most common colors (there are a lot of ways, how it can be done, but I will talk about it some other time);
 The first colors of Earth’s palette
- generate a grayscale frequency map for each selected color from color map, using some color distance metric;
 Frequency map for the first color from the palette
- use this map as a mask, apply it to the low resolution temperature/humidity and height maps and then generate a frequency curves for each color;
 Temperature frequency curves for each color in the palette
- get a range with highest values from temperature and humidity curves and then use them to encode a high resolution temperature and humidity map from a color map;
- grab all the data and apply it as a configuration to the planet.
And this is basically it. All this process is parameterized too and I spent several days tweaking it, but just in two days after the algorithm was implemented, I’ve got much better results for Earth than before.
 This colors is actually in the game
 This is how it would look like
 Before
 After. It could be improved even more, but for this stage of the development it is enough
The great thing about this algorithm is that it is universal and can be used for any planet. I don’t know if the new planets will be included in the next update (it is a lot of work even with this huge time saver), but there is a pretty high chance that I will finish all inner planets and some asteroids this year.
Thank you for your attention and see you in the v0.16.0 update!